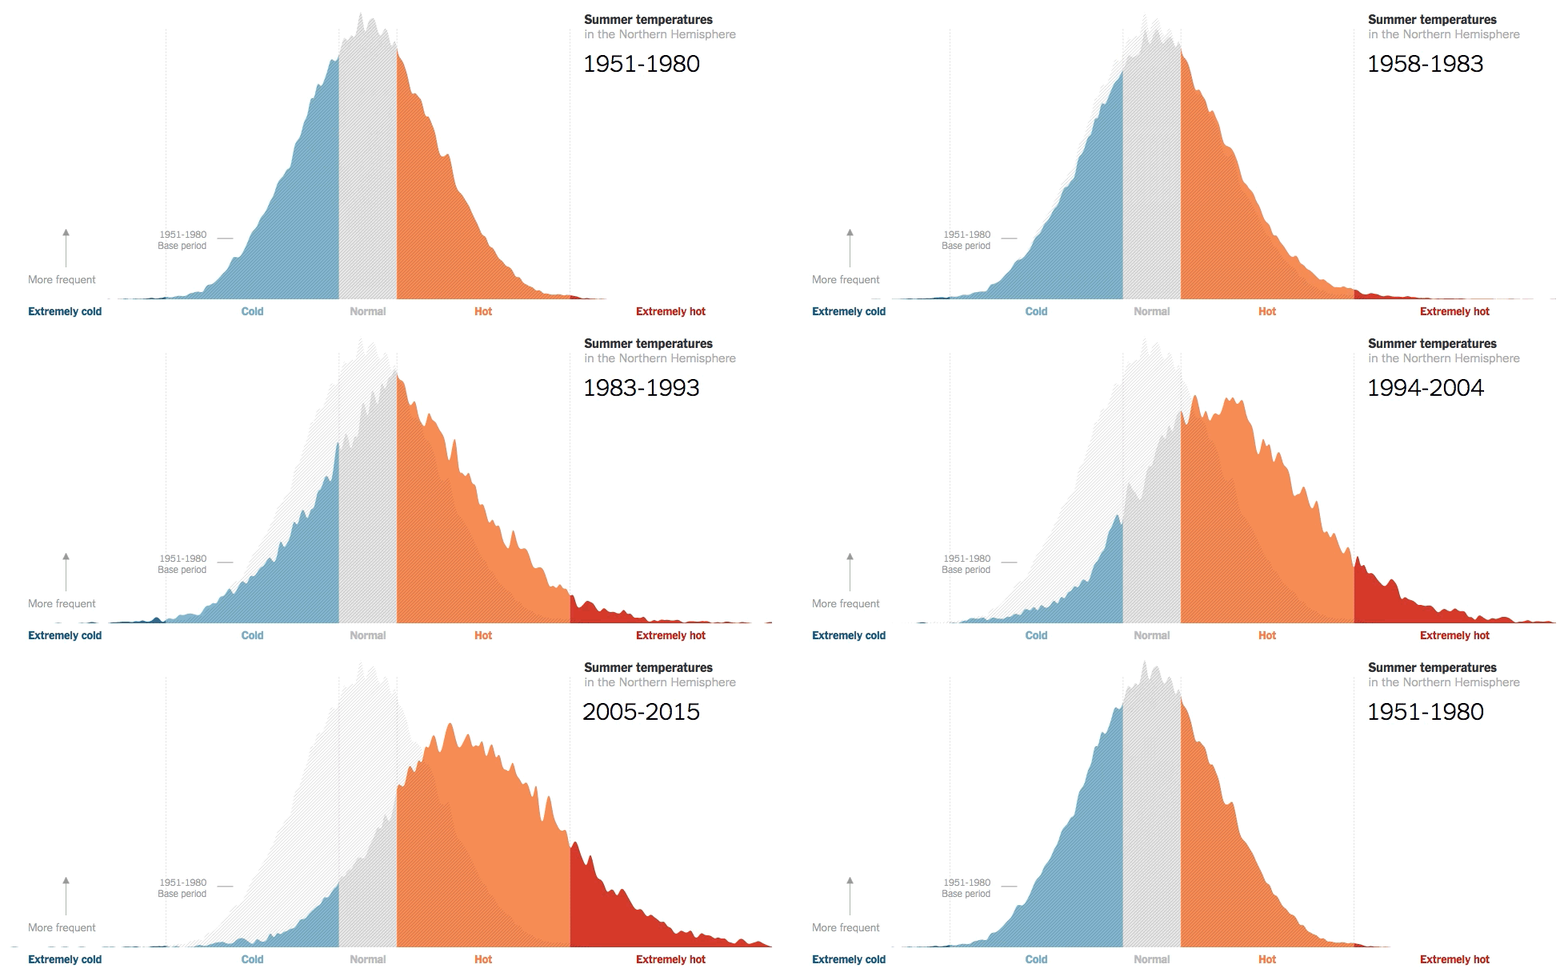
Compared to a baseline period beginning in the 1950’s, summers in the northern hemisphere are becoming increasingly hotter. This data depicts the shifting distribution of June, July, and August land temperature anomalies (departure from long-term average) over subsequent decades.
The normal distribution of the 1951 to 1980 baseline data was used to define three temperature categories (cold, normal, and hot), so that a third of the data fell into each bin. Since then, summer temperatures have shifted drastically such that between 2005 to 2015, two-thirds of all values were in the “hot” category. In fact, the distribution shifted so far that a new category “extremely hot” had to be added since almost 15% of the data exceeded the original scale.
The broadening of the distribution is also of interest since it seems to imply that there is greater temperature variability now than in the past. However, climate scientists suspect this is actually caused by parts of the world warming faster than others. When the effects of regional variability in global warming are taken into account, the increased variability in temperature anomalies is significantly reduced.
Source: https://nyti.ms/2u4xwrY
Publications: https://goo.gl/SnucV2, https://goo.gl/Jaj7f8
Data: https://goo.gl/zP8Rpk (Columbia University)
#ScienceGIF #Science #GIF #ClimateChange #Climate #Change #GlobalWarming #Global #Warming #Climatology #Temperature #Anomaly #Distribution #Hemisphere #BellCurve #Gaussian #NASA #Columbia #University #NYT #NYTimes View Original Post on Google+

